Case studies / Sample
A verified CPI feed for contract indexation
Replacing a manual quarterly copy-and-paste of inflation figures with a repeatable, checked feed straight from the Australian Bureau of Statistics.
Sample: built on public open data, not a client engagement
About this sample. Built by Titan Analytica on public open data to show our method. It is not a client engagement, and no client data was used. Source: ABS Consumer Price Index, Australia (ABS Data API), licensed under CC BY 4.0.
The problem
Leases, grants and service contracts are often indexed to the Consumer Price Index (CPI). Many organisations still copy the figures by hand from each ABS release.
Manual copying is slow, easy to get wrong (wrong city, wrong series, wrong quarter) and hard to evidence when an auditor or counterparty asks where a number came from.
Our approach
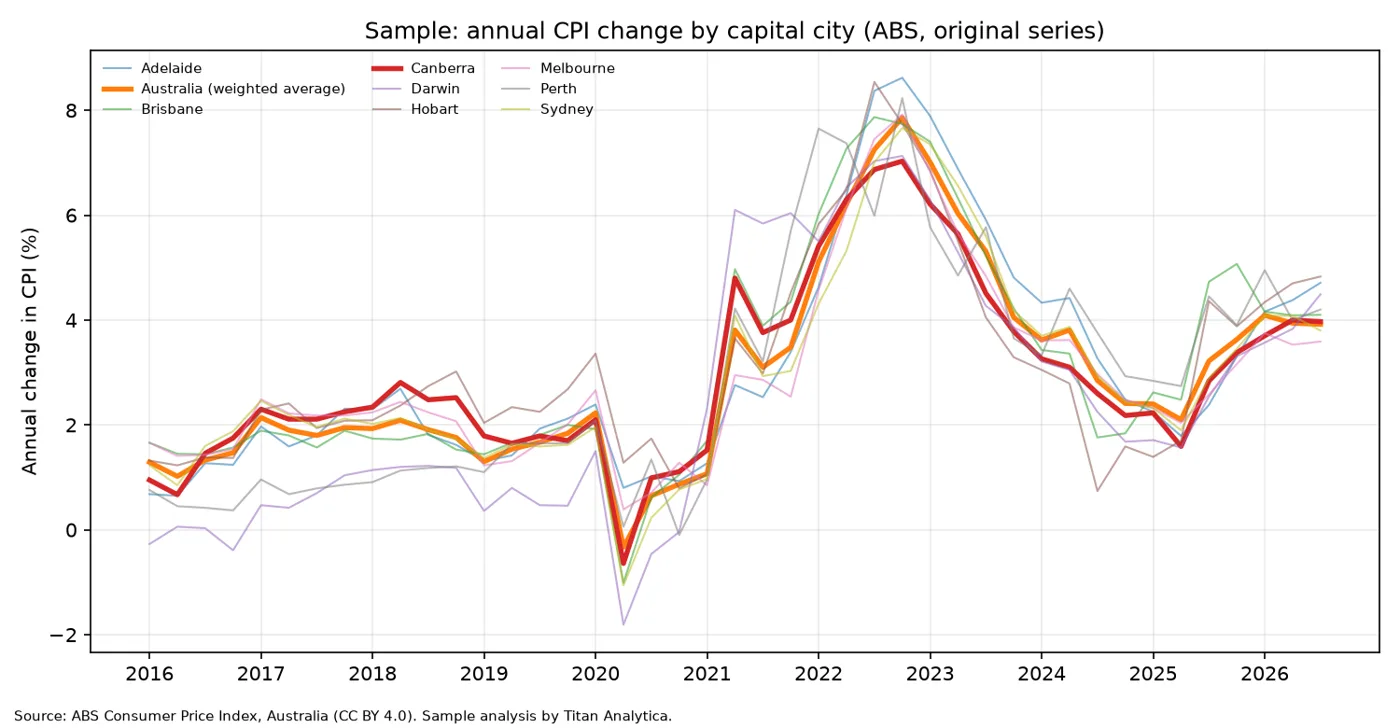
- Pulled the All groups CPI (original series, quarterly) for all eight capital cities and the national weighted average directly from the official ABS Data API, from March quarter 2015 onwards.
- Stored every raw download unchanged with a SHA-256 fingerprint, so any figure can be traced back to the exact file it came from.
- Ran six automated checks before any transformation: all regions present, equal series length, no missing values, plausible ranges, no duplicates and no gaps between quarters.
- Produced a tidy table with quarterly and annual change, a latest-quarter summary and an indexation helper that applies CPI movement to a contract value.
The result
- 423 observations (9 regions × 47 quarters, March quarter 2015 to September quarter 2026) extracted and validated, with all six checks passing.
- Calculated annual CPI change to the September quarter 2026: Canberra 3.97%, national weighted average 3.92%, ranging from Melbourne 3.59% to Hobart 4.83%.
- Indexation helper: A$100,000 indexed to Canberra CPI from the September quarter 2020 is A$127,121 at the September quarter 2026.
- The whole run takes seconds and can be scheduled to refresh on each ABS release, with the quality report saved alongside the data.
Quality checks
| Check | Outcome |
|---|---|
| All 9 regions present | Pass |
| Same number of quarters per region (47) | Pass |
| No missing index values | Pass |
| Index values within a plausible range | Pass |
| No duplicate region-quarter rows | Pass |
| No gaps in the quarterly series | Pass |
What we would do differently for a client
- Percentage changes calculated from index numbers can differ slightly from the ABS's published percentages because of rounding. A production feed should state which figure the contract refers to.
- The contract wording (which city, which series, which quarter) matters more than the code. We confirm it in writing at the scoping stage.